Device events
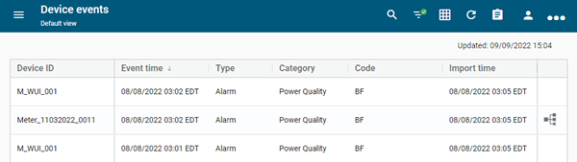
Accessible from the main menu under Device operations, the Device events interface provides a table that lists all device events and alarms reported during the selected time period. An event from a meter, endpoint device, or collector represents a condition that is recorded or detected by the device.
Note: The Device events interface is available only to users who have the EventReport permission. For users without this permission, the main menu does not contain an entry for this interface.
Events refer to historical device events that are recorded in the past that are typically collected when the meter is read. Alarms represent active conditions on a device that are typically reported to IEE at the time the event is detected. Examples of alarms include tamper flags, low battery alarms, power outages, and brief increases or decreases in voltage.
Field device operators and administrators can review device events using filters and sorting capabilities to help investigate and resolve issues.
When you first visit the Device events page, the following default filters are applied to the view:
-
Event time = Last 1 hour
-
Type = Alarm
A check mark ( ) on the Filter icon indicates that at least one filter is currently applied. For information about adjusting the filters to refine your view, see Device events filters .
Tip: Use a saved view to populate the Device events table with events that are exported to OpenWay Action Manager. For these events, workflow icons appear in the workflow column of the table. For more information about creating and using saved views, see Actions menu and View menu.
When you first visit the page, the Device events table displays the following columns:
-
Device ID. The unique identifier for a meter or other device.
-
Event time. The date and time that the event occurred.
-
Type. This can be Event or Alarm.
-
Category. Event category, such as Power Quality, Tamper, or StatusEvent.
-
Code. A short alphanumeric string that identifies the exact event. IEE includes a standard set of event codes that can be mapped to the event codes provided by external systems.
-
Description. A brief description that corresponds to the event code (for example, Physical tamper).
-
Import time. The date and time that the event was imported into IEE.
-
Workflow. If a predefined workflow is associated with an event and has been initiated, the Workflow icon (
 ) appears in this column. Select the Workflow icon to open a Workflow summary page.
The Workflow column appears only if the IEE Workflow Manager module has been licensed and installed. Workflow functionality is available only to licensed users who sign in with Windows authentication (not Itron Authentication). For licensed users without the required Edit System Settings permission in IEE, the Workflow icon appears dimmed (
 ) and contains no actionable link.
The following additional columns are also available within the table:
-
Device type. The model of the device (for example, Meter, Repeater, Collector, or Transformer).
-
Commodity. The utility service associated with the device (Electric, Water, Gas, or Undefined).
-
Latitude. The north-south geographic coordinates of the service point.
-
Longitude. The east-west geographic coordinates of the service point.
Note: Devices with latitude and longitude coordinates can be plotted on a map. See Map view.
-
External system. The system from which an event was imported.
-
Service point ID. The unique identifier of a physical service location.
-
Premise ID. The unique identifier of a service address or other location.
Tip: To refresh the current table view to reflect the most recent data, select Refresh (![]() ) in the page header.
) in the page header.
The Device events table supports the following controls:
-
By default, the table is sorted by Event time (most recent first). To change the sort order, select any column header to sort by that attribute. An up arrow appears in the column header, indicating that the sort is in ascending order. Select the column header again to switch to descending order, indicated by a down arrow.
-
To adjust the width of any column, drag the edges in the column header. To view any text that has been truncated due to width constraints, hover over the text to reveal a tooltip with full text.
-
To reorder the columns, drag a column header to the wanted location in the table.
-
To pin any column to the left or right side of the table, hover over the wanted column header, select Menu (
 ), and select Pin Column. Then select Pin Left or Pin Right. To clear a column pin, select No Pin.
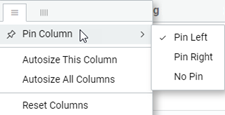
From the same menu, you can also reset the column width for either the current column or all columns. Select Autosize This Column or Autosize All Columns.
-
To hide columns or to restore hidden columns, hover over any column header and select Menu (
).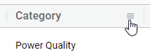
In the dialog that appears, select Column (
 ) to view the column-selection tab.
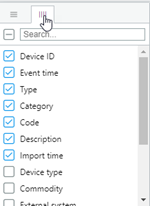
Clear the columns that you want to hide and select any hidden columns that you want to restore to the table. After making your selections, click anywhere outside the dialog to close it.
Tip: To locate a column name in a long list of columns, type part of a column name in the Search box and press Enter. Only matching results appear in the list. To restore the full list, clear the Search box.
-
To reset the columns and clear all changes to the current view, hover over any column header, select Menu (
), and select Reset Columns.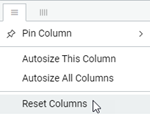
Related topics: