Reads graph
On the Interactive graphing page, the Reads graph allows you to view and analyze up to 10 service point channels at one time. When you make edits to the service point channels, the number of edits appear on the card.
-
To add additional service point channels to the graph, select the Actions menu (
 ) in the page header, and then select Add to graph.
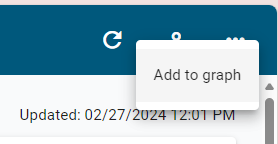
-
To view register usage on the graph, select the Actions menu (
) in the page header, and then select Show register usage.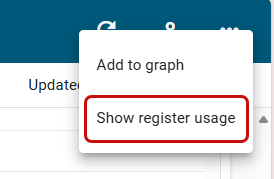
-
To hide register usage on the graph, select the Actions menu (
) in the page header, and then select Hide register usage.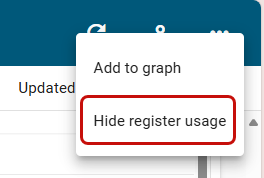
Each service point channel on the graph is represented by a color:
-
Any values that have been edited in the reads table appear on the graph in a different color (orange).
-
By default the edited interval and register values are shown on the graph. Select Edited (
 ) beneath the graph to hide the edited values. Select it again to show the edited values.
 -
When you change a cell back to its original value, the colored graph line representing the edit no longer appears on the graph.
For information on how to compare channel reads, see Comparing channel reads.
The card supports the following actions:
-
To maximize the card, click Show full page (
 ). This option is disabled when the card is collapsed.
 -
To return the card to the original view, click Restore card (
 ).
). -
To hide the data on the card, click Collapse (
 ).
). -
To show the data on the card, click Expand (
 ).
). -
To download the data represented in the graph, see Downloading interactive graphing data.
Use the following actions to refine your view of the graph:
-
On the graph, the x-axis represents time. The y-axis represents the unit of measure (UOM) for the selected channel. Hover over any point on the graph to see the date and time or to reveal color-coded tooltips with exact values. A dotted line represents missing or empty data. Refer to the legend beneath the graph for the color assigned to each service point channel.
-
Select any legend item to hide the corresponding service point channel; select it again to restore the service point channel data to the graph.
-
For a more detailed view of a time period, drag the left and right ends of the slider beneath the graph to define the zoom range, and then drag the entire slider left or right to adjust the view. You can also select an area of the chart to define the zoom range.
Tip: The x-axis and data shown on the graph automatically scale to reflect the defined range. To restore the graph to the original view, click All in the Zoom by box.
Related topics: