Interactive graphing
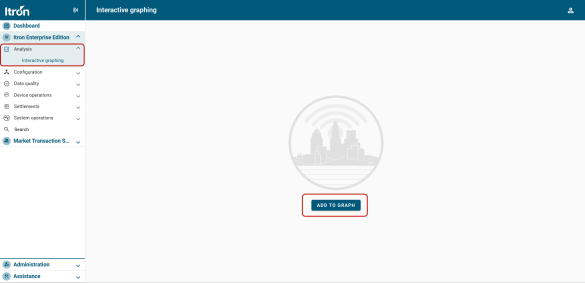
Accessible from the main menu under Analysis, the Interactive graphing interface enables authorized users to seamlessly display and edit service point readings for near real-time streaming data and historical data. The interface allows users to show multiple interval channels with different interval lengths, and multiple interval and register channels with different date ranges. By default, the page is blank and does not retain data.
Note: The Interactive graphing interface is available to users who have View Reading permission. Editing functionality is available to users who have Edit Interval Data and Edit Register Reads permissions. For users without these permissions, all editable values are disabled.
The page supports the following actions:
-
The last updated date/time for this page displays on the page header when the Interactive graphing page is loaded with data (chart and reads). To reload the page with the most recent data, click the Refresh icon (
 ) in the page header.
 -
Selecting the Add to graph button allows you to add service point channels to the graph. For more information, see Creating an interactive graph.
-
When the page contains data, the data is exportable. For more information, see Downloading interactive graphing data.
The page contains the following cards:
-
Reads. Each service point channel's data is represented on the page. For more information, see Reads graph and Reads table.
-
Channels. Displays the service point channels that are displayed on the graph. Selecting a channel displays the configuration details and summary of the channel. For more information, see Channels.
Related topics: