Creating an interactive graph
On the Interactive graphing page, you can add service point channels to the graph. For more information on service point entity types, see Performing an entity search.
Tip: You can also add service point channels to the Reads graph from the Results.
Use the following procedure to create an interactive graph:
-
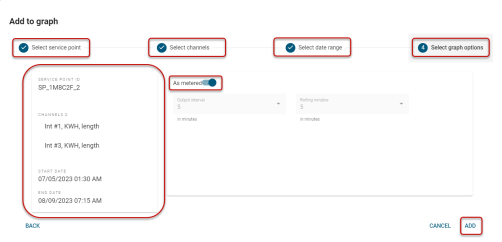
Select Add to graph. A dialog with four tabs appears. Your selections appear on the left side of the dialog.
-
On the Select service point tab, complete the Query card:
-
The following Field options are available:
-
Account ID
-
Account number
-
Market type
-
Meter ID
-
Meter number
-
Meter program ID
-
Service point description
-
Service point ID
-
Service point program ID
-
Version
By default, Operator is set to Equals.
-
-
Value. Enter a value in the text box. You can search on partial phrases, words, or numbers by using an asterisk (*) as a wildcard character.
-
Click Apply. The service point results appear in the Results table.
-
-
Select a row and click Continue.
-
On the Select channels tab, select All or select the service point channels from the Channels dropdown menu, and then select Continue.
-
On the Select data range tab:
-
Select the Date range dropdown menu and select an option: Today (default selection), Yesterday, or Custom. If you select a Custom date range, define the start date and end date parameters:
-
Select anywhere in the Start date box to open a date-picker dialog. On the Calendar tab, select a date. By default, the current date is selected.
-
-
On the Clock tab, select an hour, and then select a minute.
Note: Above the Clock tab, you can click AM or PM to change the selection if needed.
-
Repeat this process to select an end date and time. After you've selected the date range, the dialog disappears.
-
Repeat these steps to edit your custom date range selection.
Note: By default, the current user's time zone is preselected. To select a different time zone, select an option from the Time zone dropdown menu.
-
-
Click Continue.
-
On the Select graph options tab, select the following:
-
As metered (in minutes). By default, this option is enabled if one of the interval channel is added, otherwise it is disabled.
-
Output interval (in minutes). Switch the As metered option off to enable this dropdown menu.
-
Rolling window (in minutes). Switch the As metered option off to enable this dropdown menu.
Note: As metered, Output interval, and Rolling window are applicable only to interval channels. These options are disabled when no interval channels are selected.
-
-
Click Add to add the service point channel to the graph.
Related topics: