Queue details
You must have Validation Work Queue Admin permissions to perform all available actions. Some of the actions accessible in the Actions menu (![]() ) in the table are grayed out and disabled for users with only Validation Queue permissions.
) in the table are grayed out and disabled for users with only Validation Queue permissions.
Selecting Actions menu (![]() ) in the Validation queue table provides the following options:
) in the Validation queue table provides the following options:
-
Change queue state. You can change the state of an item in the queue by selecting Change queue state. In the Change queue state dialog that appears, select a new queue state using the Queue state dropdown menu, select the reason for the change from the Reason dropdown menu, (optional) use the Enter your note here box to enter notes about the change, and then select OK.
-
Graph and analyze. You can navigate directly to the Interactive graphing page for the selected Service point ID in the table by selecting Graph and analyze. The Interactive graphing page will open in a new tab and plot the graph for the duration of the validation start and end period for all the channels (up to 10 channels) in the queue.
-
Manually accept. You can manually accept items in the queue by selecting Manually accept. In the Manually accept dialog that appears, select the reason for the change from the Reason dropdown menu, (optional) use the Enter your note here box to enter notes about the change, and then select OK.
-
View queue details. To view details about a queue item in the Validation queue table, select the wanted row, or select the row's Actions menu (
 ), and then select View queue details. The Queue details dialog appears.
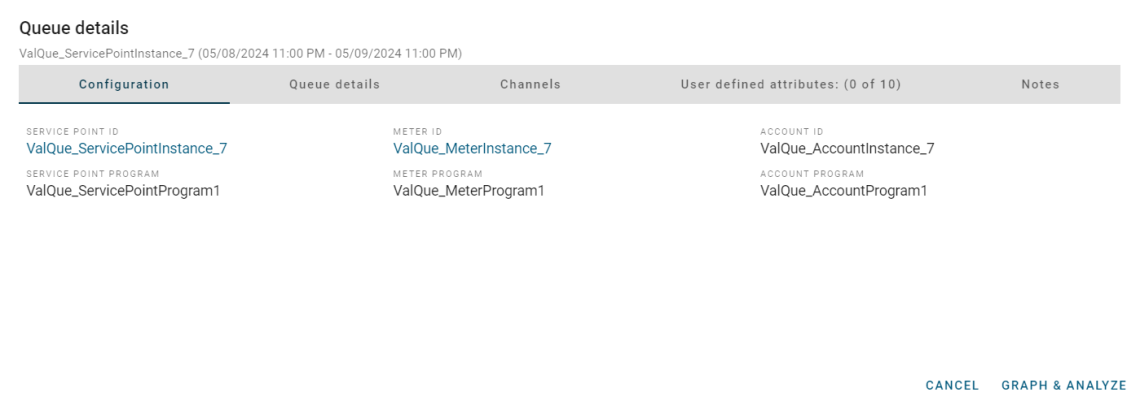
Tip: To navigate to the Interactive graphing page for the selected Service point ID, click Graph & Analyze.
Use the following tabs to review and edit validation exceptions:
-
Configuration. Displays configuration data such as Service point ID, Premise ID, Meter endpoint, Rate ID, Meter ID, Account ID, and Billing cycle ID. Clicking the Service point ID link or the Meter ID link will take you to the entities Configuration page.
-
Queue details. Displays the validation process summary data such as Validation state, Processed date, Start date, End date, Queue state, and Owner.
-
Channels. Displays a list of channels associated with the queue item with status for each (Error
 , Fail
  , Pass
  , Skip
  , or Warn
  ). Each channel has a Validation slot associated with it, and each slot can have multiple validation rules. If any thresholds are associated with the rules and a rule state is Fail or Warn, then the Actual and Expected values indicate the actual reading value and threshold value to mark the queue item as Fail or Warn, respectively.
-
Select the Service Point ID to view the Configuration maintenance: Service point ID page for the selected Service Point ID.
-
Select a Channel to view its associated validations slots and rules. In the case of multiple slots, select one of the slots to view its associated rules.
-
Slot 1 = Billing
-
Slot 2 = Data Quality / Load Research
-
Slot 3 = Other
-
-
-
User defined attributes (UDA). Lists any custom attributes applicable to the service point as defined in the IEE system settings. There can be up to ten attributes listed; the number of attributes displays next on the tab.
Tip: To configure UDAs in the IEE rich client, navigate to System Settings > ETL > ETL settings for searchable attributes.
-
Notes. Lists any user-entered notes about the exception.
-
Related topics: