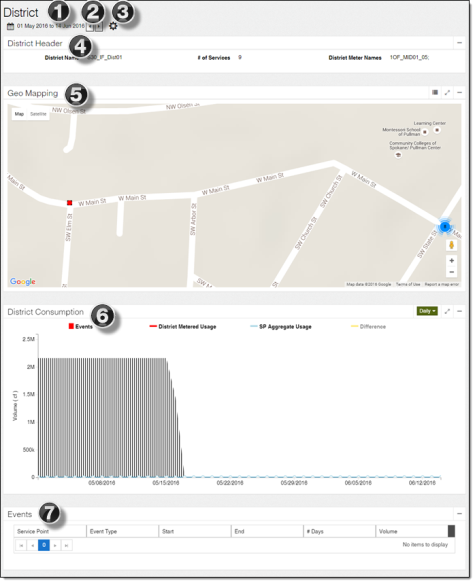
District: Gas page
The gas District page provides data visualization with maps and charts for a selected district.
-
Date Select tool. Use this tool to change the historical data displayed on the page. For more information, see Date Select tool.
-
Quick Date Change tool. Use this tool to move the selected date range forward or back by the specified or assumed (if a start and end date are selected) duration. For more information, see Quick Date Change tool.
-
Set Units tool. Use this to change the units displayed on the page. The unit defaults and options available in this tool are configured in the Admin Portal. For more information, see "Enabled Units" in the Itron Analytics Admin Portal Online Help.
-
Volume. For example, Cubic Feet or Hundreds of Cubic Feet.
-
-
District Header panel. This panel displays the following information about the district:
-
District Name. The name of the district. If the district name is not populated in the database, then Itron Analytics displays the district ID in place of district name.
-
# of Services. The number of service points associated with the district.
-
District Meter Number. The district meter's meter number. If the meter number is not populated in the database, then Itron Analytics displays the meter ID in place of meter number.
-
-
Geo Mapping map. This map highlights the district and its service points. For more information, see Geo Mapping map.
-
District Consumption chart. This chart displays the events and volumes for the district during the selected date range. For more information, see District Consumption chart.
-
Events table. This table displays the events that occurred on the service points associated with the district during the selected date range. For more information, see Events table.