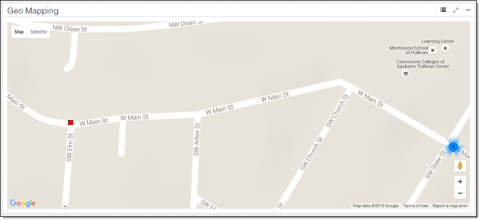
Geo Mapping map
The Geo Mapping map highlights the district, its district meters, and its service points.
For general information, see User interface basics.
-
District Layers tool (
 ). Use this to hide or show district boundaries, district meters, and service points on the map. By default, district meters and service points are enabled, and district boundaries are disabled.
 -
District boundary. Polygons indicate districts. The polygon's shape is based on the latitude and longitude of its associated service points.
-
District meter (

 ). This icon indicates a district meter. If the icon is red, it is an upstream (in) district meter. If the icon is black, it is a downstream (out) district meter. If any district meters have missing latitude and longitude data, a message at the top of the map informs the user how many district meters will not appear. Click a district meter to open a popup. For more information, see District meter popups.
 -
Service Point (

 ). The red icon indicates a single service point associated with the district. The blue icon indicates a number of service points near one another. If any service points have missing latitude and longitude data, a message at the top of the map informs the user how many service points will not appear. Click a single service point to open a popup. For more information, see Service point popups.