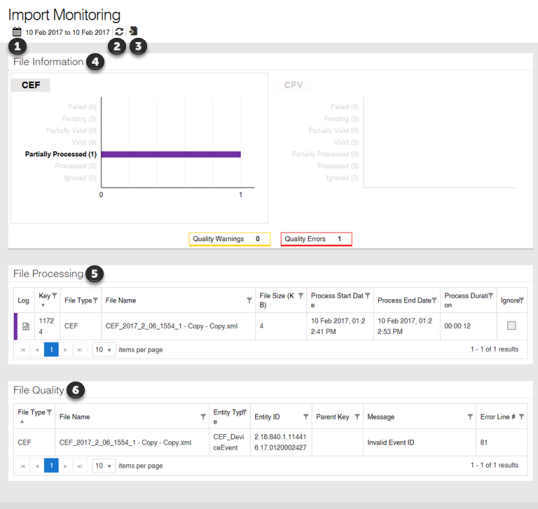
Import Monitoring
The Import Monitoring dashboard is located under the Platform Operations menu. This dashboard allows you to view the status and details of imported files, as well as information about errors that occurred while importing.
-
Date Select tool. Use this tool to change the date range of the data displayed on the page. For more information, see Selecting a date range.
-
Refresh. Click this to view the current file statuses. This is only available when today's date is at the end of the selected date range.
-
Action menu. Use this menu to open logs for the selected date range. After you open a log, you can export the data to a CSV file.
-
Full Integration Log. This log provides the start and end of processes that run to get data into the database, regardless of if the process is assigned to a specific file.
-
Integration Log - Errors Only. This log provides errors for processes that run to get data into the database, regardless of if the process is assigned to a specific file.
-
Full Database Process (ETL) Log. This log provides the start and end of processes that run to propagate imported data through the database so it is available to the application.
-
Database Process (ETL) Log - Errors Only. This log provides errors for processes that run to propagate imported data through the database so it is available to the application.
-
-
File Information panel. This panel contains charts displaying the import status of each type of file. For more information, see File Information panel.
-
File Processing table. This table displays information about each imported file. For more information, see File Processing table.
-
File Quality table. This table displays information about errors reported during the import process. For more information, see File Quality table.