Event Investigation page
The Event Investigation page displays all service points and sensors with recorded events filtered by investigation type. Initially, the page is blank. Click the View menu icon in the page header to open the menu.

Note: For more information, see View menu.
The following table describes the available page views by investigation category and type.
|
Category |
Investigation Type |
|---|---|
|
Detect |
|
|
Review |
|
|
Silence Data |
|
|
Sensors |
|
|
Service Points |
|
|
Note: By default, the data is presented in a table. For service points and sensors with latitude and longitude information, you can view the data on a map. Click the table icon in the page header and then select Map.
Select Table to switch back to table view. |
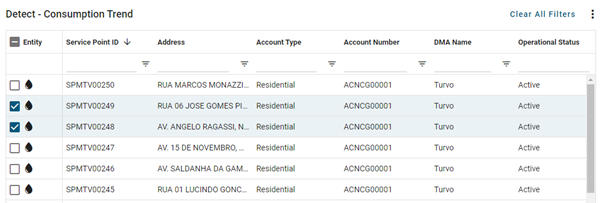
The selected investigation table displays information for each service point or sensor. For details about the displayed fields, see Service point and sensor information.
The investigation tables support the following controls:
-
For the Detect, Review, and Silence Data investigation types, select one or more checkboxes to view detailed information and to access management options. For more information, see Investigation actions
-
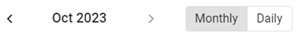
For the Sensors and Service Points investigation types, you can toggle between Monthly and Daily data at the top of the page. Use the arrow icons to scroll between months or days, or click the date shown to make your selection from a date picker.
-
In the Entity column, click a water icon (
 ) to navigate to the associated Service point ID (entity) page.
 -
To filter the items within a column, click the filter icon (
 ) in the desired column, select an operator, type all or part of a value in the Filter field, and click Apply. Only matching results appear in the list.
Tip: For quick column filtering, type all or part of a value in the blank search field of the desired column and press Enter. This feature uses the Contains operator.
To restore the full list within a column, click the filter icon (
) again and then click Reset. To reset all filters for all columns, click Clear All Filters in the table header. -
To reorder the columns, drag a column header to the desired location in the table.
-
To change the sort order, click any column header to sort by that attribute. An up arrow appears in the column header, indicating that the sort is in ascending order. Click the column header again to switch to descending order, indicated by a down arrow.
-
To pin any column to the left or right side of the table, hover over the desired column header, click the horizontal menu icon (
 ), and select Pin Column. Then select Pin Left or Pin Right. To clear a column pin, select No Pin.
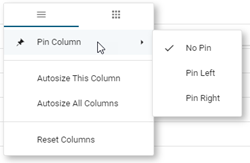
Tip: From the same menu, you can also reset the column width for either the current column or all columns. Select Autosize This Column or Autosize All Columns.
-
To hide columns or to restore hidden columns, hover over any column header and click the horizontal menu icon (
). In the dialog that appears, click the grid icon to view the column-selection tab.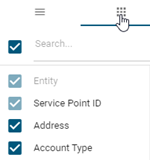
Deselect the columns that you want to hide, and select any hidden columns that you want to restore to the table. After making your selections, click anywhere outside the dialog to close it.
Tip: To locate a column name in a long list of columns, type all or part of a column name in the Search box and press Enter. Only matching results appear in the list. To restore the full list, clear the Search box.
-
To reset the columns and clear all changes to the current view, hover over any column header, click the horizontal menu icon (
), and select Reset Columns. -
Drag to select any section of the table to copy the text to your clipboard or to view a custom chart for the selected cells only. After selecting multiple cells, right-click on the selected area and then select Copy, Copy With Headers, or Chart Range.
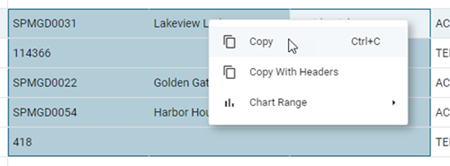
A copied selection can be pasted into a spreadsheet or text editor. If you select Chart Range, you can then select a chart type. After the chart appears, you can click the download icon (
 ) to save the chart as an image file.
Tip: By default, charts are linked to the table data in real time. If the data changes, the chart updates. To prevent the chart from updating while you are viewing it, click the link icon (
 ) in the graph header to unlink it from the grid; click it again to link the chart to the grid.
 -
To export the data represented in the table, click the Actions menu icon (
 ) and select Export. A .csv file is saved to your browser's configured download location.
Note: The export file includes all available rows and columns, regardless of rows selected or column visibility options.
See also: