Validation cards
Validation cards show the aggregated reads count that have successfully passed validation for the current day (from midnight to the most recent updated time).
The card displays when the database job was last run, including the date, time, and data of the update. Click Refresh (![]() ) in the page header to update the date and time; the card's data only changes after the database job runs.
) in the page header to update the date and time; the card's data only changes after the database job runs.
Tip: The cards on the dashboard are automatically refreshed based on the card refresh rate setting for Web UI.
The data shown on a Validation card depends on its size.
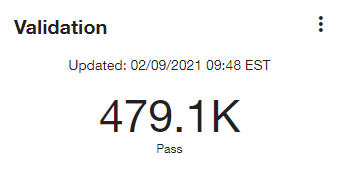
The small Validation card indicates the total number of service points that have passed validation in the last 24 hours and displays the most recent update time.
-
Hover over the KPI value on the card to reveal a tooltip with the exact count and percentage of devices that have passed validation in the last 24 hours.
-
Select data on the card to navigate to the Validation queue with the default view applied. If you change your filters on the Validation queue screen, you can save the new view. To save the new view as a favorite for quick access, select Actions menu (
 ) in the page header and select Save view. The first favorite shown in your Favorites list becomes your default view.
For more information, see Validation queue filters and View menu.
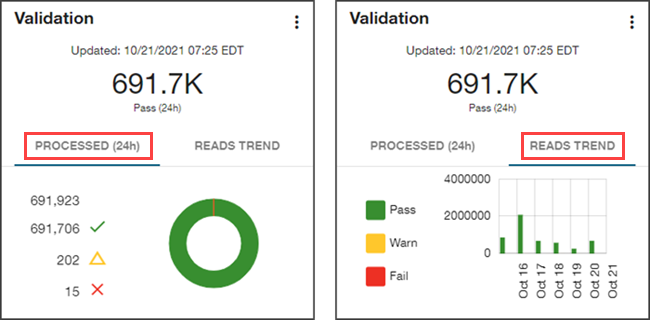
The medium Validation card provides additional information and features a Processed (24h) tab and a Reads Trend tab.
-
Select data on the card (Failed and Error ) to navigate to the Validation queue with the default view applied. If you change your filters on the Validation queue screen, you can save the new view.
-
To save the new view as a favorite for quick access, select Actions menu (
) in the page header and select Save view. The first favorite shown in your Favorites list becomes your default view.
-
These tabs provide the following validation information:
-
Processed (24h). Select this tab to display a validation summary for the past 24 hours, indicating the total number of validation attempts, the number of validations attempts that passed (
 ), the number of validation attempts that failed (
 ), and the number of validation attempts that were in a warning state (
 ) as of the most recent update time. This information is also represented in a color-coded doughnut chart.
-
Select Fail (
) to navigate to the Validation queue with the selected filters applied (validation state and processed date).
-
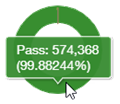
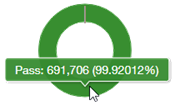
Hover over a section of the doughnut chart to reveal a tooltip with the exact count and percentage of the total that the section represents.
-
-
Reads Trend. Select this tab to display a color-coded bar chart representing validation attempts over the last seven days. For each day, the chart represents the number of validation attempts that passed (
), the number of validation attempts that failed (), and the number of validation attempts that were in a warning state (). -
Hover over a bar on the graph to reveal a tooltip with the exact count and percentage that the bar represents for that day.
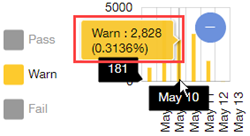
Depending on the location of your pointer (as shown in the preceding image), the date appears on the x-axis (for example, Oct 20 in the preceding image), and the count appears on the y-axis (for example, 1379), giving you an idea of the scale represented by the graph. As you move the pointer, this information updates automatically.
-
Select a Fail bar to navigate to the Validation queue with the selected filters applied (validation state and validation date).
-
Select a legend item (Pass, Warn, or Fail) beside the bar graph to hide the corresponding data in the graph. Hiding the Pass data is useful if you need a better view of the Warn and Fail bar graphs. If most of the service points have passed validation, then the other bars may be too small by comparison to appear on the graph. In the following example, the Pass information has been hidden.
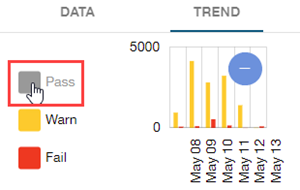
When selected, the Pass legend item changes from green to light gray to indicate that this data is hidden on the graph. Select the legend item again to show the hidden data. To zoom out so that the scale of entire endpoint population is represented on the graph, click Zoom Out ( ). To restore the original scale, select or clear any legend item.
-
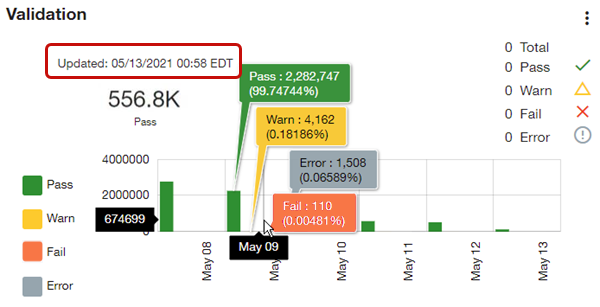
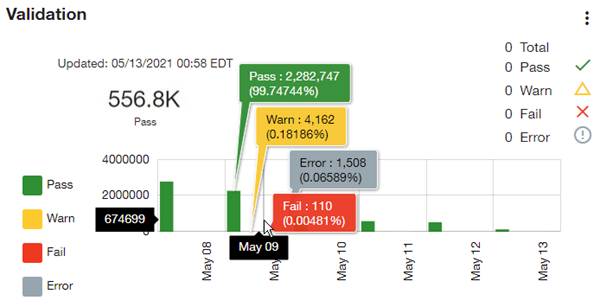
The large Validation card provides an expanded view of validations for the current day and includes the total number of error states. The Total value shown on the card represents all received validation reads for all shown states. However, if there are 558,131 service points in the system, for example, but the Total shown on the card is 557,301, then 830 service points have not been included in the total. This could be because no readings have been received from these service points or because some of these service points have states other than Pass, Warn, Fail, or Error (such as Skip or Manually accepted). In this case, the sum of the individual states does not add up to the total.
Important! The Validation card always indicates the worst state at the channel level, which is rolled up to the service point level. For example, if a polyphase service point with three channels has one channel that passes validation, one channel that fails validation, and one channel with a warning state, then the worst of these states (Fail) is shown on the card.
-
Select data on the card to navigate to the Validation queue with the default view applied. If you change your filters on the Validation queue screen, you can save the new view.
-
To save the new view as a favorite for quick access, select Actions menu (
) in the page header and select Save view. The first favorite shown in your Favorites list becomes your default view.
For more information, see Validation queue filters and View menu.
-
The large Validation card supports the following actions to help you view the data represented:
-
Hover over a bar to reveal tooltips with the exact counts and percentages represented (as shown in the preceding image).
-
Depending on the location of your pointer (as shown in the preceding image), the date appears on the x-axis (for example, Oct 17 in the preceding image), and the count appears on the y-axis (for example, 3172414), giving you an idea of the scale represented by the graph. As you move the pointer, this information updates automatically.
-
Hover over a section of the doughnut chart to reveal a tooltip with the exact count and percentage of the total that the section represents.
-
Select Fail (
) or Error ( ) to navigate to the Validation queue with the selected filters applied (validation state and processed date).
 -
Select a Fail or Error bar to navigate to the Validation queue with the selected filters applied (validation state and validation date).
Note: If you change your filters on the Validation queue page, you can save the new view and select it as a favorite for quick access. The first favorite shown in your Favorites list becomes your default view. For more information, see Validation queue filters and View menu.
-
Select a legend item (Pass, Warn, Fail, or Error) beside the bar graph to hide the corresponding data in the graph. Hiding the Pass data is useful if you need a better view of the Warn, Fail, and Error bar graphs. If most of the service points have passed validation, then the other bars may be too small by comparison to appear on the graph. In the following example, the Pass information has been hidden in the graph.
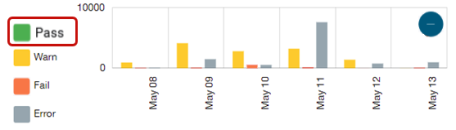
When selected, the Pass legend item changes from green to light gray to indicate that this data is hidden on the graph. Select the legend item again to show the hidden data; the original color is restored. -
To zoom out so that the scale of entire endpoint population is represented on the graph, click Zoom Out (
). To restore the original scale, select or clear any legend item.
Related topics: