Medium validation card
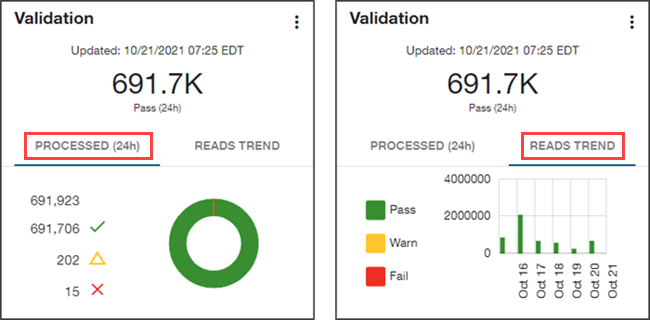
The medium Validation card provides additional information and features a Processed (24h) tab and a Reads Trend tab.
These tabs provide the following validation information:
-
Processed (24h). Select this tab to display a validation summary for the past 24 hours, indicating the total number of validation attempts, the number of validations attempts that passed (
 ), the number of validation attempts that failed (
 ), and the number of validation attempts that were in a warning state (
 ) as of the most recent update time. This information is also represented in a color-coded doughnut chart.
Select Fail (
) to navigate to the Validation queue with the selected filters applied (validation state and processed date).Tip: Hover over a section of the doughnut chart to reveal a tooltip with the exact count and percentage of the total that the section represents.

-
Reads Trend. Select this tab to display a color-coded bar chart representing validation attempts over the last seven days. For each day, the chart represents the number of validation attempts that passed (green), the number of validation attempts that failed (red), and the number of validation attempts that were in a warning state (yellow).
Hover over a bar on the graph to reveal a tooltip with the exact count and percentage that the bar represents for that day.
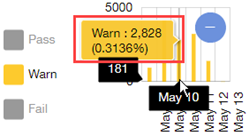
Depending on the location of your pointer (as shown in the preceding image), the date appears on the x-axis (for example, Oct 20 in the preceding image), and the count appears on the y-axis (for example, 1379), giving you an idea of the scale represented by the graph. As you move the pointer, this information updates automatically.
Select a Fail bar to navigate to the Validation queue with the selected filters applied (validation state and validation date).
Tip: Select a legend item (Pass, Warn, or Fail) beside the bar graph to hide the corresponding data in the graph. Hiding the Pass data is useful if you need a better view of the Warn and Fail bar graphs. If the majority of the service points have passed validation, then the other bars may be too small by comparison to appear on the graph. In the following example, the Pass information has been hidden.
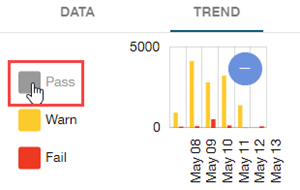
When selected, the Pass legend item changes from green to light gray to indicate that this data is hidden on the graph. Select the legend item again to show the hidden data. To zoom out so that the scale of entire endpoint population is represented on the graph, click Zoom Out ( ). To restore the original scale, select or clear any legend item.
Related topics: