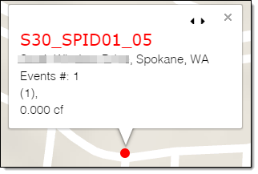
Service point popups
-
Next/Previous service point (
 ). Click the arrows to view other service points at the same location. This only appears if service point icons overlap when zoomed in on the map.
 -
Service point name. The unique identification number for a location that receives utility service. The service point ID is a link. Click the link to view detailed information about the service point on the Service Point Detail page.
-
Address. The address of the service point.
-
Events #. The number of analytic events on the service point during the selected date range.
-
List of Events. The types of analytic events (with count in parentheses) on the service point during the selected date range. Analytic events include:
-
No Usage on Active. An active service point had usage below a specified threshold for a specified number of days. The usage also must be a positive value.
-
Usage on Inactive. An inactive service point had usage above a specified threshold for a specified number of days.
-
Tamper. A service point had a Tamper analytic event. Tamper analytic events are triggered by associated device events in the CEF file or OpenWay Collection Manager API. For example, a cut cable device event would trigger a Tamper analytic event.
-
Meter Temperature. A service point has a Meter Temperature analytic event. Meter Temperature events occur when a threshold on the meter indicates that the meter's temperature is too cold or hot to function.
-
Low Battery.The meter's or device's battery is low and should be replaced.
Note: These events are defined by thresholds set in the Admin Portal. For more information, see "Analytic Events" in the Itron Analytics Admin Portal Online Help.
-
-
Volume. The volume reported by the service point during the selected date range. This value is displayed in the unit chosen in the Set Units tool.