Dashboard
Navigate to Outcomes > Dashboard to view key performance indicators (KPIs) for a snapshot of system activities shown in custom panels, or cards, which contain transaction statistics and colour-coded bar charts. These cards also serve as entry points to detailed MTS transaction views prepopulated with KPI-specific search criteria (all transactions represented by the KPI value). The Dashboard supports the following cards:
- Meter data requests received or sent
- Service orders received
- Customer details notifications received
- Customer details requests sent
- Site access notifications received or sent
- Site access requests received or sent
- AMI export
For information about configuring your dashboard cards, see Managing Dashboard Cards.
On a typical KPI dashboard card, a number represents the total number of transactions (for example, service orders) received since midnight compared to the total number of transactions received for the same period in the previous year. In the following example, the first number (61) represents the total number of service orders received today, and the second number (50) the average over the same weekday in the same month of the previous year.
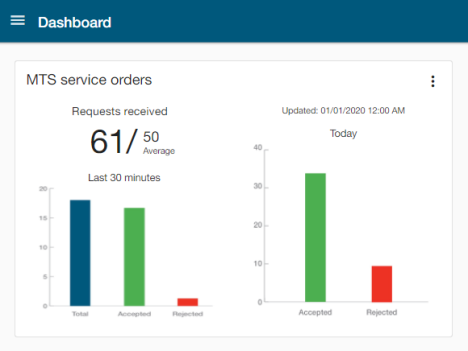
Tip: Hover over a bar on the graph to reveal the exact count that the bar represents. You can also click on a bar or KPI value to navigate to an MTS Transactions search page with the filters set to show only the items represented by the bar.
For most card types, each card displays bar charts for the last Last 30 minutes and Today (since midnight). For a chart labeled Last 30 minutes, the blue bar represents the total number of transactions received since midnight and is broken down by accepted (green) and rejected (red).
Note: The large and medium card sizes display graphing for both the Last 30 minutes and Today. For the medium card size, you can toggle between these graph types. On the small card size, only a 30 minutes chart displays. The KPI representing total transactions and averages displays for all card sizes. See also Managing Dashboard Cards.
The MTS AMI export card represents the progress of the daily early-morning meter data dispatch. The count of NMIs dispatched versus the total expected is displayed on all card sizes. The dispatched value displays in green if it is within 1% of the expected value. The medium card also shows a chart of number of NMIs sent by status (Accepted, Rejected, Partially Accepted, or Unresponded).
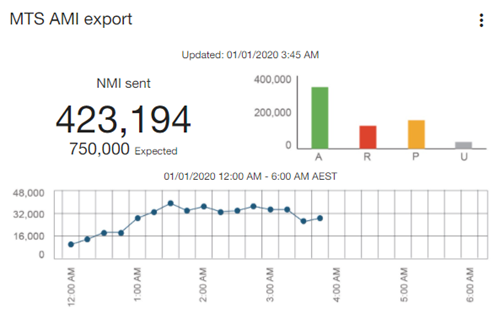
The large card (shown above) includes a line graph of the progressive export within a fixed midnight-to-6 AM window.
Note: The line graph on the MTS AMI export card represents the number of NMIs published to the market. Because each NMI's data is sent to at least two recipients, the actual numbers will be higher than indicated by the count and graph.
As with other card types, you can click on a bar or KPI value to navigate to an MTS Transactions search page with the filters set to show only the items represented by the bar.