Service Mode cards
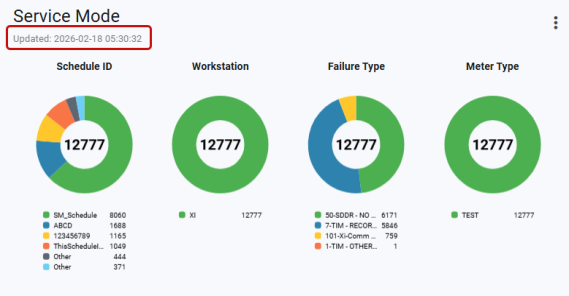
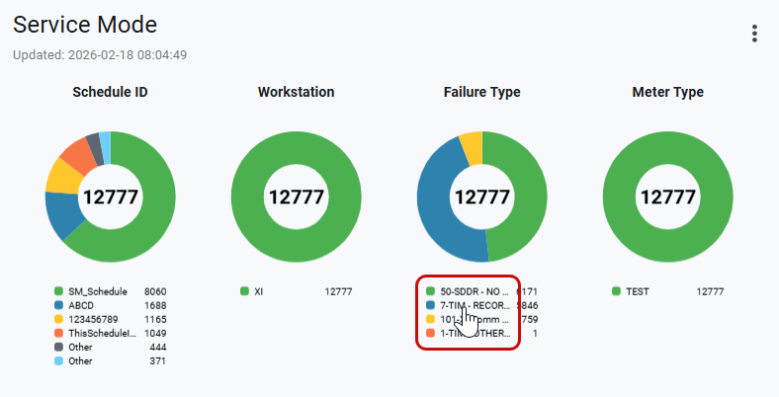
Service Mode cards display data regarding the number of failed Service Mode interrogations occurring between BOT and EOT. By default, Service Mode cards appear in the form of large-sized cards and cannot be resized.
The last updated date and time appears on the card. To refresh the data on the card, click Refresh (![]() ) in the page header.
) in the page header.
Tip: The cards on the dashboard are automatically refreshed based on the card refresh rate setting for Web UI.
The following information appears on the card:
-
Schedule ID
-
Workstation
-
Failure Type
-
Meter Type
Service Mode cards provide the following details to help you view the data represented:
-
Each doughnut chart legend displays up to five categories, sorted in descending order by count.
-
If there are more than five categories, an aggregated "Other" category is added as the last legend item, regardless of its total compared to the top five categories.
-
The center of each doughnut chart shows the total count for the corresponding queue categories.
-
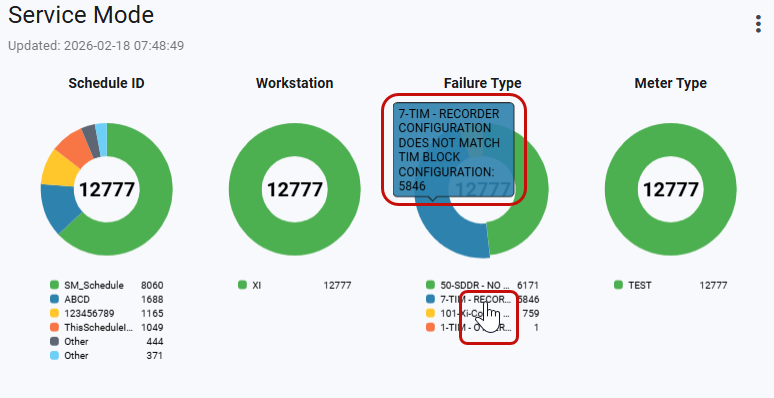
Long legend labels are truncated with an ellipsis (...); hovering over a truncated label or doughnut segment displays a tooltip with the category ID count (ID:count).
Note: Service Mode cards are informational only and do not support navigation to any Web UI screens.
Service Mode cards allow you to:
-
Hover over a section of the doughnut chart to reveal a tooltip that displays the category ID and the number of items in that category.
-
Click a status on the doughnut chart to view it separately. Click each status again to reassemble the chart.
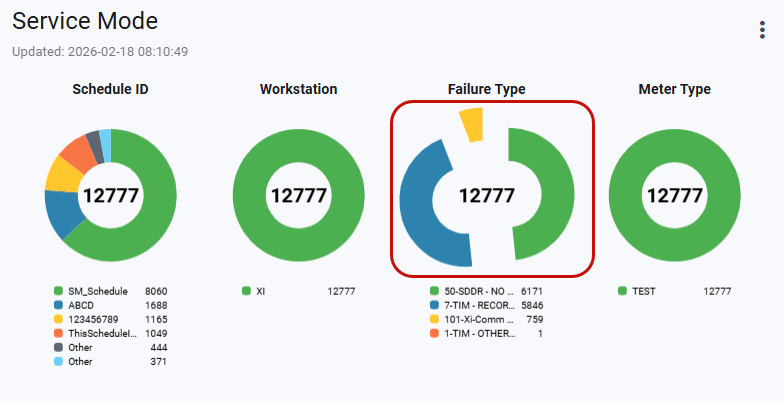
Tip: The chart reassembles automatically when the page refreshes.
-
To hide a status from the doughnut chart, select the status in the legend. The status changes from a color to light gray to indicate it is hidden on the graph. Select the legend item again to show the hidden data; the original color is restored.
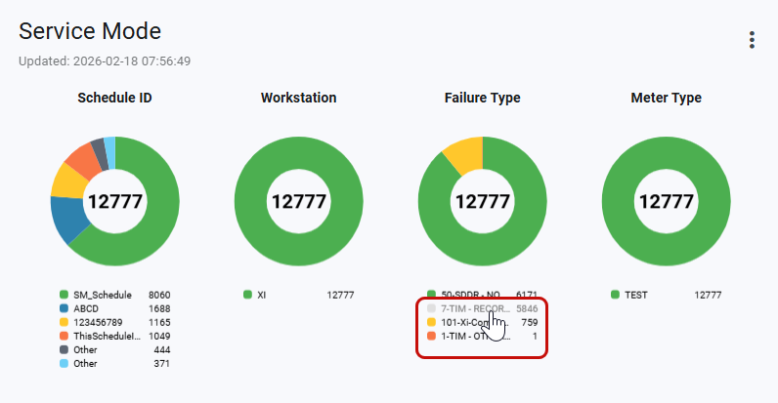
Select the legend item again to show the hidden data; the original color is restored.
Related topics: