Reads graph
On the Interactive graphing page, the Reads graph allow you to view and analyze up to 10 service point channels at one time.
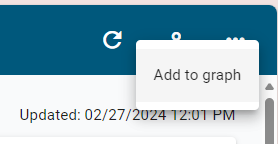
To add additional service point channels to the graph, use Actions menu (![]() ) in the page header to select the Add to graph option.
) in the page header to select the Add to graph option.
Tip: Each service point channel in the Reads graph is represented by a color.
For information on how to compare channel reads, see Comparing channel reads.
The Reads panel supports the following controls:
-
To maximize the panel, click Maximize (
 ).
). -
To restore the panel to the original view, click Minimize (
 ).
). -
To collapse the panel, clickUp (
 ).
). -
To expand a collapsed panel, click Down (
 ).
).
Use the following controls to refine your view of the Reads graph:
-
To narrow or expand the scope of the graph, select a Zoom by option:
-
1H: One hour
-
1D: One day
-
1W: One week
-
All: The entire selected date range
Note: The Zoom by options vary according to the selected Date range.
-
-
On the graph, the x-axis represents time. The y-axis represents the unit of measure (UOM) for the selected channel. Hover over any point on the graph to reveal color-coded tooltips with exact values. A dotted line represents missing or empty data. Refer to the legend beneath the graph for the color assigned to each service point channel.
-
Select any legend item to hide the corresponding service point channel; select it again to restore the service point channel data to the graph.
-
For a more detailed view of a time period, drag the left and right ends of the slider beneath the graph to define the zoom range, and then drag the entire slider left or right to adjust the view. You can also select an area of the chart to define the zoom range.
The x-axis and data shown on the graph automatically scale to reflect the defined range. To restore the graph to the original view, click All in the Zoom by box.
-
To download the data represented in the Reads graph, see Exporting interactive graphing data.
Related topics: