Report table
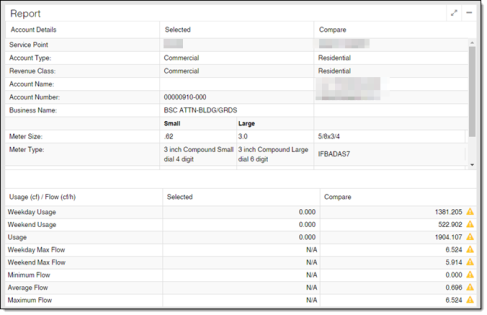
The Report table displays details and usage during the selected date range for both the service points or groups being compared.
Note: Usage and flow values in the chart reported as "No Data" indicate that data doesn't exist for the specified value, a value was not recorded. Usage and flow values of zero (0.000) indicate that an actual data value of zero was recorded.
Note: If a service point is compared to itself, the Account Details section will not display the duplicate information.
Note: If a group is selected, the Account Details section will not display data.
Note: This table supports estimated and missing reads. Estimated reads are indicated with a hollow icon  . For more information on estimation, see "Itron Analytics Estimation" in the Itron Analytics Admin Portal Online Help. Missing reads are indicated with a solid icon
  .
.
In the Fixed Network collection engine, you can fill missing data by performing an On-Demand Interval Data Read. For more information, see "Performing an On-Demand Interval Data Read" in the Network Collection Engine v5.1 User Guide.
-
Export (
 ). Click to export the table to a CSV. The generated CSV includes a header which provides the selected, selected date range, compared, and compared date range attributes for the comparisons. Estimated and missing reads are indicated in the CSV in an additional column. One field is added for selected missing/estimated reads, and another field for compared missing/estimated reads. For more information, see User interface basics.
 -
Service Point. The unique identification number for a location that receives utility service. Click this to view the Service Point Details page for the selected service point.
-
Account Type. The type of account associated with the selected service point. This can be Residential, Commercial, Industrial, or Undefined.
-
Account Name. The customer name associated with the selected service point.
-
Account Number. The account number associated with the selected service point.
-
Meter Size. The size of the meter installed at the service point. For traditional compound meters, these values are provided for the small and large meters. For fireline compound meters, these values are provided for the small, large, and fireline meters.
-
Meter Type. The type of the meter installed at the service point. For traditional compound meters, these values are provided for the small and large meters. For fireline compound meters, these values are provided for the small, large, and fireline meters.
-
Meter Number. The identification number of the meter installed at the service point. For traditional compound meters, these values are provided for the small and large meters. For fireline compound meters, these values are provided for the small, large, and fireline meters.
-
Endpoint ID. The identification number of the endpoint installed at the service point. For traditional compound meters, these values are provided for the small and large meters. For fireline compound meters, these values are provided for the small, large, and fireline meters.
-
Endpoint Install Date. The date of installation of the endpoint installed at the service point. For traditional compound meters, these values are provided for the small and large meters. For fireline compound meters, these values are provided for the small, large, and fireline meters.
-
Weekday Usage. The total usage on weekdays (minus configured holidays) over the selected date range. If you are comparing Group Average, this will be the sum of the average usage. If you are comparing Group Total, this will be the sum of the total usage.
-
Weekend Usage. The total usage on weekends and configured holidays over the selected date range. If you are comparing Group Average, this will be the sum of the average usage. If you are comparing Group Total, this will be the sum of the total usage.
-
Usage. The total usage over the selected date range. If you are comparing Group Average, this will be the sum of the average usage. If you are comparing Group Total, this will be the sum of the total usage.
-
Weekday Max Flow. The maximum flow recorded on a weekday (minus configured holidays) during the selected date range. If you are comparing Group Average, this will be the highest average maximum flow. If you are comparing Group Total, this will be the highest flow of any service point in the group.
-
Weekend Max Flow. The maximum flow recorded on a weekend or configured holiday during the selected date range. If you are comparing Group Average, this will be the highest average maximum flow. If you are comparing Group Total, this will be the highest flow of any service point in the group.
-
Minimum Flow. The minimum flow recorded during the selected date range. If you are comparing Group Average, this will be the lowest average minimum flow. If you are comparing Group Total, this will be the lowest flow of any service point in the group.
-
Average Flow. The average flow calculated during the selected date range.
-
Maximum Flow. The maximum flow recorded during the selected date range. If you are comparing Group Average, this will be the highest average maximum flow. If you are comparing Group Total, this will be the highest flow of any service point in the group.