Monthly/Weekly chart
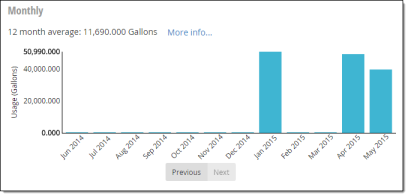
Utility customers can use the Monthly/Weekly chart to get detailed usage information for particular months or weeks in a year. The chart will display monthly or weekly information based on the setting in Edit User Information.
-
More info. Utility customers click this to view a summary of usage information during the selected date range. For more information, see Viewing monthly/weekly information summary as a utility customer.
-
Monthly/weekly chart. This chart displays each month's or week's usage during the selected date range.
-
Y-Axis. Usage in the default unit.
-
X-Axis. Months over the selected date range.
-
Chart Data. Hover over data on the chart to view a tooltip displaying the month/week and usage. Click data on the chart to view that month's or week's data in the Daily chart. For more information, see Daily chart.
-
-
Previous/Next. Utility customers click this to view usage data for earlier or later time periods.
-
Previous. Click this to view the previous data.
-
Next. Click this to view the next data.
-