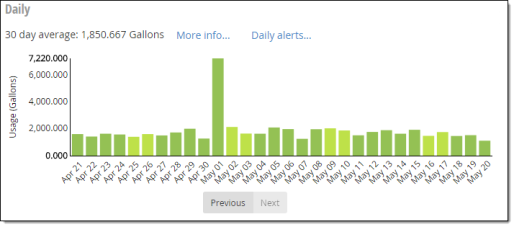
Daily chart
Utility customers can use the Daily chart to get detailed usage information for particular days in a month. They can also set usage alerts with this panel.
-
More info. Utility customers click this to view a summary of usage information during the selected date range. For more information, see Viewing daily information summary as a utility customer.
-
Daily alerts. Utility customers click this to enable daily usage alerts. For more information, see Setting daily alerts as a utility customer.
-
Daily chart. This chart displays each day's usage during the selected date range.
-
Y-Axis. Usage in the default unit.
-
X-Axis. Dates over the selected date range.
-
Chart Data. Hover over data on the chart to view a tooltip displaying the date and usage. Click data on the chart to view hourly usage for that date. For more information, see Viewing hourly usage as a utility customer.
-
-
Previous/Next. Utility customers click this to view usage data for earlier or later months.
-
Previous. Click this to view the previous month's data.
-
Next. Click this to view the next month's data.
-