District boundary popups
-
Next/Previous district (
 ). Click the arrows to view information of other overlapping districts. This only appears if districts overlap on the map.
 -
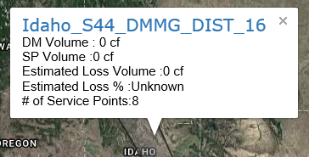
District name. The name of the district. If the district name is not populated in the database, then Itron Analytics displays the district ID in place of district name. Click this to open the District page. For more information, see District: Gas page.
-
DM Volume. The sum of volume for all district meters associated with the district during the selected date range. This value is displayed in the unit chosen in the Set Units tool.
-
SP Volume. The sum of volume for all service points associated with the district during the selected date range. This value is displayed in the unit chosen in the Set Units tool.
-
Estimated Loss Volume. The estimated loss volume. If volume, the value is displayed in the unit chosen in the Set Units tool. The calculation for estimated loss volume is: (Sum of inflow district meters volume – Sum of outflow district meters volume) – (Sum of service point consumption volume)
-
Estimated Loss %. The estimated percentage of loss. The calculation for estimated percentage loss is: {[Sum of inflow district meters volume – Sum of outflow district meters volume) – Sum of service point consumption volume)] / (Sum of inflow district meters volume – Sum of outflow district meters volume)} • 100
Note: All estimated percentage of loss calculations are rounded to the nearest whole number.
-
# of Service points. The number of service points associated with the district.