Embedded reports (Power BI)
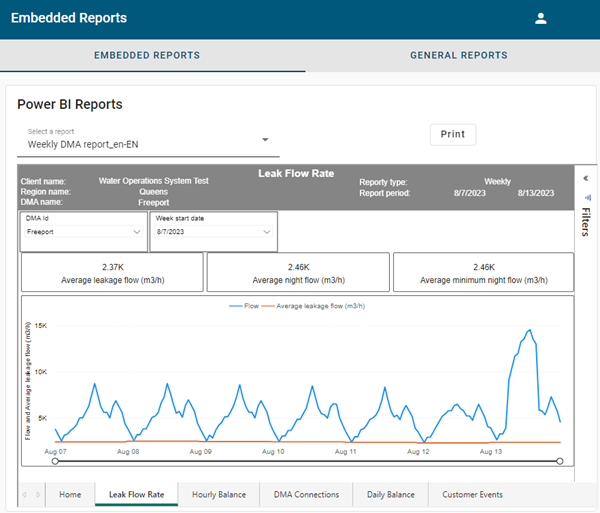
When you first arrive on the Embedded Reports tab, no report is shown. From the Select a report dropdown, select an available option (for example, Weekly DMA report).
Use the following controls to select the DMA, date range, and report view:
-
Select an available DMA from the DMA ID dropdown.
-
Select a week from the Week start date dropdown.
-
At the bottom of the page, select one of the following report tabs:
-
Home. Describes the purpose of the report.
-
Leak Flow Rate. Displays average leakage flow, average night flow, and average minimum night flow (MNF) in cubic meters per hour (m3/h) over the selected week.
Tip: For a more detailed view of the data, drag the left and right ends of the slider beneath the graph to define the zoom range, and then drag the entire slider left or right to adjust the view.
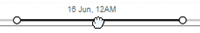
The x-axis and data shown on the graph automatically scale to reflect the defined range.
-
Hourly Balance. Displays distributed volume, consumption volume, real losses, apparent losses, and total losses in cubic meters per hour (m3/h) over the selected week.
-
DMA Connections. Displays partial-day data, full-day data, and the number of connections in the DMA over the selected week. This view includes a table with additional information for each day of the selected week.
-
Daily Balance. Displays both a chart and a table with consumption volume, apparent losses, real losses, and unauthorized losses in cubic meters per hour (m3/h) over the selected week.
-
Customer Events. Displays a table of customer events by service point ID and event name.
Note: Select the Event name checkboxes to filter by event type. Select the Is new checkboxes to filter by new events (1) or existing events (0).
-
Each report view supports the following controls:
-
To print the current view of the report, click Print. In the dialog that appears, open the Destination dropdown and select an available printer or Save as PDF. Then click Print or Save (depending on your Destination selection).
-
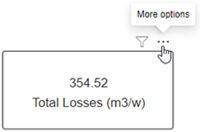
To export the selected data shown on any report tab, use the following procedure:
-
Hover over the data type to export (for example, Total losses). The More options menu icon appears.
-
Click the menu icon and select Export data. A dialog appears.
-
From the File format dropdown, select .xlsx (150,000-row maximum) or .csv (30,000-row maximum).
-
Click Export. The file saves to your browser's configured download location.
-