Sector water balance
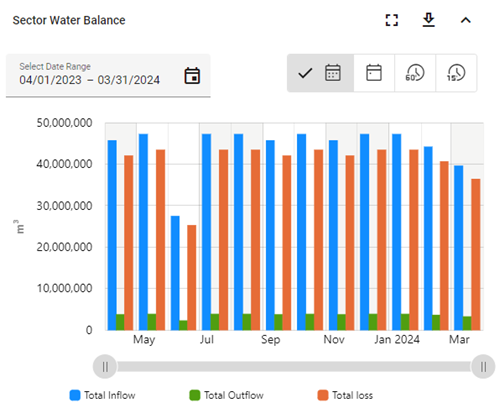
The Sector Water Balance chart provides inflow, outflow, and total loss data for the selected entity.
Tip: To expand the panel for a larger display, click the maximize icon (![]() ). To restore the panel to its original size, click the minimize icon (
). To restore the panel to its original size, click the minimize icon (![]() ).
).
Refer to the legend beneath the chart for the color assigned to each metric. Click any legend items to hide the corresponding metrics; click again to restore the hidden metrics.

The x-axis represents the timeline within the selected date range. The y-axis represents cubic meters per hour (m3/h) or cubic feet per hour (cf/h), depending on whether the tenant uses metric or imperial units (see Units of measurement).
The Sector Water Balance panel supports the following controls:
-
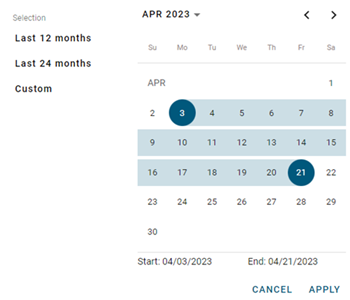
By default, the last completed 12 months are shown, regardless of the date range shown or selected in the page header. To change the timeline represented on the x-axis, select an option from the calendar dropdown: Last 12 months, Last 24 months, or Custom range.
For the Custom option, select a date range from the calendar.
-
Click the beginning date on the calendar. Use the arrow icons to scroll to the desired month.
-
Click the end date on the calendar. The selected dates appear highlighted in blue.
-
Click Apply. The data displayed in the chart updates accordingly.
-
-
The chart displays monthly data by default. If available, select the Daily, Hourly, or Sub-Hourly icon above the graph to view more granular data if it exists within the selected date range.
-
For a more detailed view of the data, drag the left and right ends of the slider beneath the graph to define the zoom range, and then drag the entire slider left or right to adjust the view.

The x-axis and data shown on the graph automatically scale to reflect the defined range. To restore the graph to its original view, click the Zoom out icon (
 ).
). -
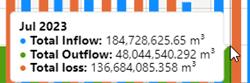
Hover over a point on the chart to reveal a tooltip with exact values for that point on the timeline.
-
To export the water balance data for the selected date range, use the following procedure:
-
Click the download icon (
 ). A dialog appears.
 -
From the Format dropdown, select Image or Data.
-
From the File type dropdown, select one of the following options:
-
Image format: Select JPG or PNG.
-
Data format: Select CSV.
-
-
Click Export. The file saves to your browser's configured download location.
-