Tank level
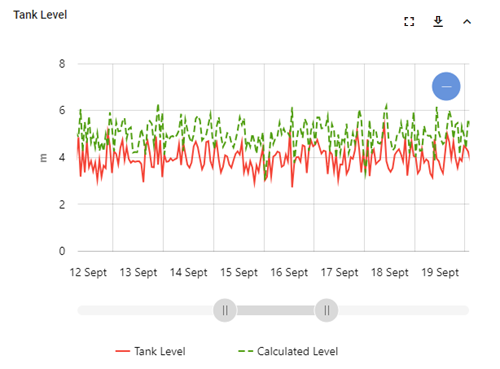
The Tank Level chart displays only for tank entities and provides inflow, outflow, and tank level data for the selected water-tank sector during the selected date range.
Note: Water-storage sectors that contain multiple tanks are represented as a single storage entity in this panel.
Tip: To expand the panel for a larger display, click the maximize icon (![]() ). To restore the panel to its original size, click the minimize icon (
). To restore the panel to its original size, click the minimize icon (![]() ).
).
The x-axis represents the timeline within the selected date range. The y-axis represents the actual tank level and the calculated level in meters (m).
Refer to the legend beneath the chart for the color assigned to each metric. Click a legend item to hide the corresponding metric; click again to restore the hidden metric.
|
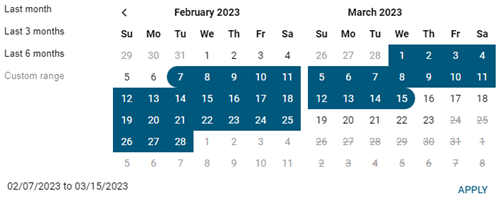
Tip: By default, Last month is selected. To change the date range, click the calendar icon ( For the Custom range option, select a date range from the calendar.
|
The Tank Level panel supports the following controls:
-
For a more detailed view of the data, drag the left and right ends of the slider beneath the graph to define the zoom range, and then drag the entire slider left or right to adjust the view.

The x-axis and data shown on the graph automatically scale to reflect the defined range. To restore the graph to its original view, click the Zoom out icon (
 ).
). -
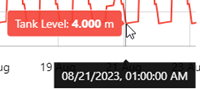
Hover over a point on the chart to reveal tooltips with exact values and timestamp.
-
To export the water balance data for the selected date range, use the following procedure:
-
Click the download icon (
 ). A dialog appears.
 -
From the Format dropdown, select Image or Data.
-
From the File type dropdown, select one of the following options:
-
Image format: Select JPG or PNG.
-
Data format: Select CSV.
-
-
Click Export. The file saves to your browser's configured download location.
-