Status
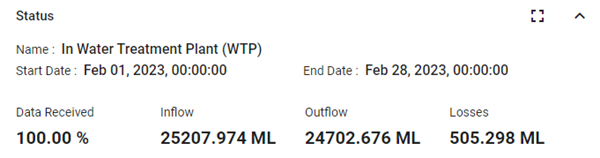
The Status panel provides a summary of the entity selected from the Sectors table, including the name of the sector, the date range represented on the page, the percentage of expected data received, inflow volume, outflow volume, and losses (inflow minus outflow).
Note: To change the selected date range, use the calendar in the page header. For details, see Sector ID.
Tip: To expand the panel for a larger display, click the maximize icon (![]() ). To restore the panel to its original size, click the minimize icon (
). To restore the panel to its original size, click the minimize icon (![]() ).
).
The percentage of data received represents the average of the total expected data from all sensors within the sector. For example, if there are no null readings over the course of the date range, then 100.00% is displayed.