Region details
On the Operational Visibility page, the details section displays in-depth information about the selected region.
Note: You can select a region either on the map or in the List of regions table.
Tip: To expand the panel for a larger display, click the maximize icon (![]() ). To restore the panel to its original size, click the minimize icon (
). To restore the panel to its original size, click the minimize icon (![]() ).
).
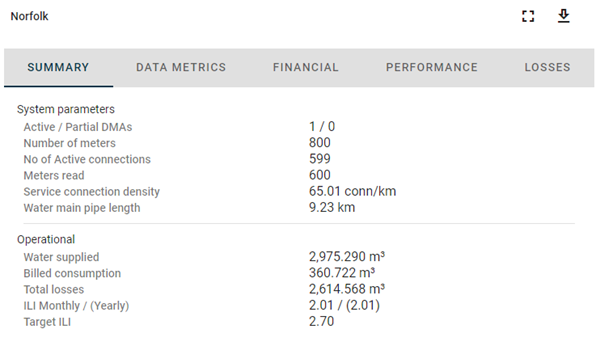
The details panel includes the following tabs:
-
Summary. Displays service connections, average pressure, current Infrastructure Leakage Index (ILI), and more.
-
Data Metrics. Displays sensor data quality (ratio of received data to expected data), connection data quality (ratio of received service points to billable service points), and data granularity.
-
Financial. Displays costs and lost revenue associated with losses.
-
Performance. Displays pressure, current annual real losses (CARL), and unavoidable annual real losses (UARL).
-
Losses. Displays apparent losses and real losses.
To export the data represented in the panel, click the download icon ( ). A .csv file is saved to your browser's configured download location.
Note: The export file includes the data from all tabs in the details panel, regardless of the current tab selection.