Dashboard
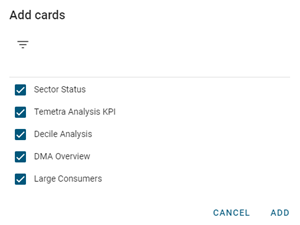
The Dashboard provides a summary view of selected system statuses shown in custom panels, or cards, which contain statistics, color-coded charts, and an optional table view (on some cards). When you first visit the dashboard as a new user, your dashboard contains no cards. Click Add cards to get started. In the dialog that appears, select the desired card or cards and then click Add.
Note: Your cards, card configurations, and dashboard layout will persist until you change them. The settings will remain intact after you log off and will be available on your dashboard when you log on again.
The dashboard supports the following cards:
-
Sector Status. Provides a summary of a selected sector's total inflow, total outflow, total losses, and volume gain. Click the sector ID to navigate to the corresponding Sector ID entity page.
Tip: The Sector Status card supports a threshold configuration for total losses. If the configured threshold has not been exceeded, the card background appears blue, but if the configured threshold has been exceeded, the background appears red. To configure the threshold, click the Menu icon (
 ) on the card and select Configure.
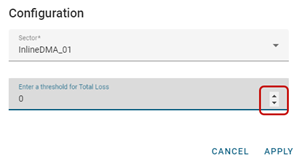
In the Configuration dialog, use the arrow icons to select a value in the field labeled Enter a threshold for Total Loss. Click Apply to save your changes.
-
Temetra Analysis KPI. Displays information about a selected region, date-range, and key performance indicator (KPI) combination. To configure the card, click the Menu icon (
) on the card and complete the following fields in the Configuration dialog: Title, Region, Priority KPI, Performers, Period, and Color. Click Apply. -
Decile Analysis. Displays information about consumption used, per consumer, during a calendar month within each DMA. To configure the card display, click the Menu icon (
) on the card and select a Region and DMA in the Configuration dialog. Click Apply.Note: By default, Always show data for previous month is selected in the Configuration dialog. To select a different month, deselect this option and then select a month from the date picker that appears.
-
DMA Overview. Displays information about total consumption used for the total number of service points and consumer types (Commercial, Industrial, and Residential). To configure the card display, click the Menu icon (
) on the card and select a Region and DMA in the Configuration dialog. Click Apply.Note: By default, Always show data for previous month is selected in the Configuration dialog. To select a different month, deselect this option and then select a month from the date picker that appears.
-
Large Consumers. Displays information about consumption used for each service point and consumer type (Commercial, Industrial, and Residential). To configure the card display, click the Menu icon (
) on the card and select a Region and DMA in the Configuration dialog. Click Apply.Note: By default, Always show data for previous month is selected in the Configuration dialog. To select a different month, deselect this option and then select a month from the date picker that appears.
See also Managing dashboard cards.