DMA model chart
On the Model Visualization DMA model page, the chart panel (beneath the DMA model map) displays simulated data for any DMA node that is selected on the map.

The x-axis represents hourly timestamps. The y-axis represents the unit of measurement for the node type:
-
Pressure nodes simulate distance in meters (m).
-
Flow nodes simulate volumetric flow in liters per second (L/s).
The modeling chart supports the following controls:
-
To add simulated data to the chart, select a node icon on the map. For more information, see DMA model map.
-
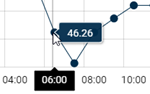
Hover over a simulated data point in the chart to reveal a tooltip with the exact value for that point.
-
To export the simulated data for the node represented in the DMA model chart, use the following procedure:
-
Click the Actions menu icon (
 ) and select Export. A dialog appears.
 -
From the Format dropdown, select Image or Data.
-
From the File type dropdown, select one of the following options:
-
Image format: Select JPG or PNG.
-
Data format: Select CSV.
-
-
Click Export. The file saves to your browser's configured download location.
-