N1 test
This test occurs during the night period when flow and pressure are most stable. If the minimum night flow period is in effect at 2:30 AM, then the period would typically start around 2:00 AM and finish around 4:00 AM. The time-frame window should be reduced if the pressure/flow stability period is relatively short. It may be the case that the minimum night period is not the same for each day of the week. Weekends are typically quite different from weekdays, with Monday and Friday also being quite different from Tuesday through Thursday (which typically follows similar diurnal flow patterns). Tests should be avoided around holidays or events as these can skew the results.
Typically, a stable period occurs during minimum night flow when flow does not increase above the minimum night flow value by more than 10%. If, for example, the stable period occurs between 2:00 AM to 3:00 AM, then 15-minute observation change periods may be used.
Note: The stabilization of DMA flow changes may take 10 to 15 minutes to occur.
In the following example, the test starts at 2:00 AM and continues until 4:00 AM, with 30-minute test intervals. The testing steps are as follows:
-
Ensure that the DMA is fully closed and that all large consumers are either not consuming or have consumption monitored with hourly/sub-hourly loggers.
-
2:00 AM:
-
Start logging of flow at bulk inlet to DMA (5, 10, or 15 minute recording interval).
-
Start logging of pressure at critical point (minimum pressure point) (5, 10, or 15 minute recording interval).
-
-
2:30 AM:
-
Reduce / choke inlet flow by an additional 1–5% such that a noticeable reduction in pressure is observed at the critical point (a step change).
-
Record flow and pressure.
-
-
3:00 AM:
-
Reduce/choke inlet flow by an additional 1–5% such that a noticeable reduction in pressure is observed at the critical point (a step change).
-
Record flow and pressure.
-
-
3:30 AM:
-
Reduce/choke inlet flow by an additional 1–5% such that a noticeable reduction in pressure is observed at the critical point (a step change).
-
Record flow and pressure.
-
-
4:00 AM:
-
Record flow and pressure.
-
Open valve at inlet to the previous setting and record final flow and pressure.
-
-
Repeat steps 1–6 over two additional days so that an average of the results can be obtained.
Example of results
The following one-day example assumes that there are no large consumers within the DMA; otherwise, the consumption from large consumers must be subtracted from the flow measurement.
|
DMA Tuesday May 2, 2022 |
Time |
Flow (m3/h) inlet |
Pressure (mH2O) critical point |
N1 |
Average |
|---|---|---|---|---|---|
|
Initial reading |
02:00 |
55.5 |
53.7 |
|
|
|
Step 3 |
02:30 |
55.1 |
53.1 |
1.553 |
|
|
Step 4 |
03:00 |
53.0 |
49.8 |
1.651 |
|
|
Step 5 |
03:30 |
52.6 |
49.2 |
1.600 |
|
|
Step 6 |
04:00 |
52.4 |
48.7 |
2.681 |
|
|
Information only |
04:10 |
51.7 |
56.1 |
|
1.871 |
Once this information is obtained, N1 is calculated for the periods when the step change occurred (2:00–2:30, 2:30–3:00, 3:00–3:30, and 3:30–4:00).
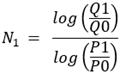
Where:
Q1 = Flow after a flow restriction has occurred (example at 2:30 AM)
Q0 = Flow in steady state before restriction (example at 2:00 AM)
P1 = Pressure after a flow restriction has occurred (example at 2:30 AM)
P0 = Pressure in steady state before restriction (example at 2:00 AM)
The average of the N1 results is then obtained for the night. This test is then repeated for two additional nights, and the average of the three averages is used as the N1 value for the FND calculation.
Note: The alignment of the flow and pressure data to obtain an accurate N1 value can be very complex. Itron data scientists can perform the N1 calculation for each DMA if the utility is able to provide the field data.