DMA water balance
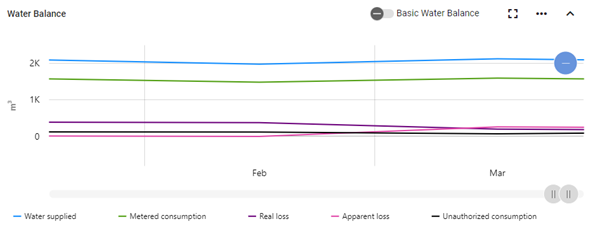
The Water Balance panel consists of three separate but interactive charts that display monthly, daily, and hourly water balance data for the DMA selected from the List of DMAs table (DMA ID column) on a Region page (see List of DMAs).
By default, the charts display the Full Water Balance view if the data is available. To switch to the basic water balance view, click the Basic Water Balance button in the chart header.

Note: The check mark indicates that the Basic Water Balance view selection is active.
The Full Water Balance view displays the following metrics:
-
Water supplied
-
Metered consumption
-
Real loss
-
Apparent loss
-
Unauthorized consumption
The Basic Water Balance view displays the following metrics:
-
Water supplied
-
Metered consumption
-
Total loss
-
Non-revenue water (NRW) percentage
|
Note: The following calculations apply to total loss and non-revenue water (NRW) values:
NRW values are limited so that maximum NRW does not exceed +/-100%. See also Real losses (physical losses) and Apparent losses (commercial losses). |
For a more granular view on any chart, drag the left and right ends of the slider beneath the graph to define the zoom range, and then drag the entire slider left or right to adjust the timeline view.

The x-axis and data shown on the graph automatically scale to reflect the defined range. To restore the graph to its original view, click the Zoom out icon ( ).
).
Monthly
The monthly water balance chart represents data over time and corresponds with the data shown in the daily chart below if no more than three months are selected with the slider below the monthly chart (see the note about the timeline slider above).
The x-axis represents the timeline, and the y-axis represents volume in the configured unit, such as m3 (see Units of measurement). Refer to the legend beneath the chart for the color assigned to each metric. Click a legend item to hide the corresponding metric; click it again to restore the hidden metric.

Daily
The daily water balance chart represents data over time (with weekends highlighted in yellow) and displays a subset of the timeline of the monthly chart above if no more than three months are selected on the monthly chart (see the note about the timeline slider above).
Note: If more than three months are selected on the monthly chart, then the timeline of the daily chart operates independently of the monthly chart.
The x-axis represents the timeline, and the y-axis represents volume in the configured unit, such as m3. Refer to the legend beneath the chart for the color assigned to each metric. Click a legend item to hide the corresponding metric; click it again to restore the hidden metric.

Hourly
The hourly water balance chart represents data over time and displays a subset of the timeline of the daily chart above if no more than 30 days are selected on the monthly chart (see the note about the timeline slider above).
Note: If more than 30 days are selected on the daily chart, then the timeline of the hourly chart operates independently of the daily chart.
The x-axis represents the timeline, and the y-axis represents volume in the configured unit, such as m3. Refer to the legend beneath the chart for the color assigned to each metric. Click a legend item to hide the corresponding metric; click it again to restore the hidden metric.

The DMA water balance charts support the following controls:
-
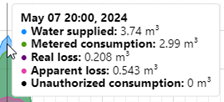
Hover over a point on any chart to reveal tooltips with exact values and monthly, daily, or hourly timestamps. The following tooltip image shows full water balance values, including real loss, apparent loss, and unauthorized consumption.

The following tooltip image shows basic water balance values, including total loss and NRW.

-
To export the data from any of the charts, use the following procedure:
-
Click the Actions menu icon (
 ) and select Export monthly chart, Export daily chart, or Export hourly chart. A dialog appears.
 -
From the Format dropdown, select Image or Data.
-
From the File type dropdown, select one of the following options:
-
Image format: Select JPG or PNG.
-
Data format: Select CSV.
-
-
Click Export. The file saves to your browser's configured download location.
-