NMI Readings
The NMI readings report provides daily meter data quality information for the selected NMI. This page features a colour-coded summary of data quality, followed by expandable panels for additional details by month for up to one year in the past. This feature is available only to user personas with roles that include the “View Reading Data Quality” grant.
Important! The date range defaults to the current day and extends back to one year prior. However, if forward-estimate reads for future dates exist, the date range defaults to the future-most date with a forward estimate.
The summary chart at the top of the screen consists of columns that represent every week in the default date range. The seven rows represent days of the week. If you hover over any cell in the chart, a tooltip shows the calendar date for that cell. Click a cell to open the expanding panel that corresponds to that month.
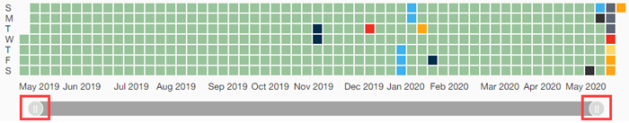
To shift the date-range view, drag the left or right handles of the navigator beneath the chart to the desired beginning and end dates. The graph automatically adjusts based on the new date range. The date range cannot extend further into the past or future than the default view allows.
The charts use the following colours (and codes in the monthly panels) to represent the daily data quality types:
- Green (A). All Actual data for the day is complete.
- Dark blue (S). At least one read for the day is a Substitute read.
- Light blue (F). At least one read for the day has a Final Estimate status.
- Grey (E). At least one read for the day is an Estimate read.
- Red (I). At least one read for the day is an Invalid read.
- Yellow (V). At least one read for the day is not Validated.
- Orange (N). At least one read for the day is missing or empty (Nonexistent).
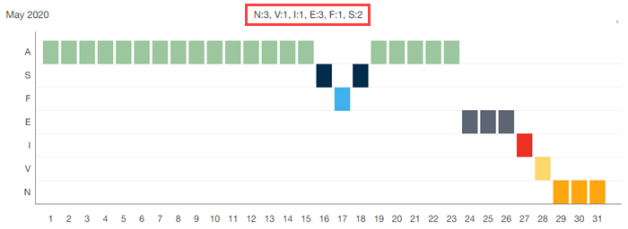
Important! A day with multiple read qualities is classified according to the following hierarchy: N, V, I, E, F, S, A. For example, a day with both Substitute (S) and Invalid (I) reads would be classified as Invalid (I).
Below the summary chart are expandable panels, each containing a chart that represents the entire month. Simply click on a panel to reveal the chart for the selected month. The x-axis represents the days of the month. The y-axis represents the possible daily data quality types (as described above). Each day contains a colour-coded cell to indicate data quality. Each panel, whether expanded or collapsed, displays a textual summary of the month's problematic days.
Hover over any cell to reveal a tooltip showing the date, the channel, and the time ranges of the individual read qualities over the course of that day. In the following example, the pointer is hovering over the cell for the 29th day of the month.
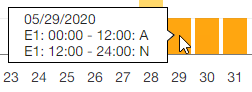
Note: The timestamp shown in the tooltip represents the NMI's local time.
The Action menu (![]() ) in the page header provides the option to select MTS transactions to view all transaction details associated with the NMI. This action takes you to the MTS Transactions search page and automatically applies the following criteria to the search filter:
) in the page header provides the option to select MTS transactions to view all transaction details associated with the NMI. This action takes you to the MTS Transactions search page and automatically applies the following criteria to the search filter:
- NMI = The NMI identifier shown in the NMI readings page header
- Transaction type = Meter data notification
- Received/Sent = Sent