Visual Studio (VS) Code
You may want to install an integrated development environment (IDE) or code editor such as Eclipse, CodeLite, or Microsoft Visual Studio (VS) Code.
This section describes how to install and configure VS Code onto the Ubuntu 22.04 64-bit VM. It also includes instructions on how to attach the GNU Debugger (GDB) using VS Code to the third-party reference agent.
Install VS Code
On the Ubuntu VM, install VS Code. This is done in a terminal window as user “dev”.
-
Install the VS Code repository and signing key to enable automatic updates. Type the following commands in the terminal window:
-
cd~
-
wget -qO- https://packages.microsoft.com/keys/microsoft.asc | gpg --dearmor > packages.microsoft.gpg
-
sudo install -o root -g root -m 644 packages.microsoft.gpg /etc/apt/trusted.gpg.d/
-
sudo sh -c 'echo "deb [arch=amd64 signed-by=/etc/apt/trusted.gpg.d/packages.microsoft.gpg] https://packages.microsoft.com/repos/vscode stable main" > /etc/apt/sources.list.d/vscode.list'
-
rm packages.microsoft.gpg
-
-
Update the apt repository using, sudo apt update
-
If required, install the apt-transport-https and gvfs-bin dependencies using:
-
sudo apt install apt-transport-https
-
sudo apt install gvfs-bin
-
-
The latest version of VS Code in Linux are available from Visual Studio Code.
Configure VS Code to develop and debug C++ code
-
Logon to the Ubuntu desktop as user dev and open a terminal window.
-
Create a directory to hold the DI code using mkdir -p ~/Documents/DI/Code
-
Create a symbolic link to the reference agent using ln -s ~/DistributedIntelligenceDesktopSDK/Agents/ThirdPartyReferenceAgent ~/Documents/DI/Code/ThirdPartyReferenceAgent
-
Navigate to the ThirdPartyReferenceAgent directory using cd ~/Documents/DI/Code/ThirdPartyReferenceAgent
-
Start VS Code using code
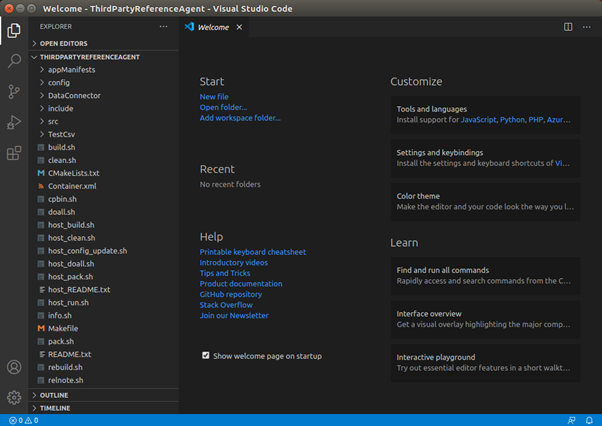
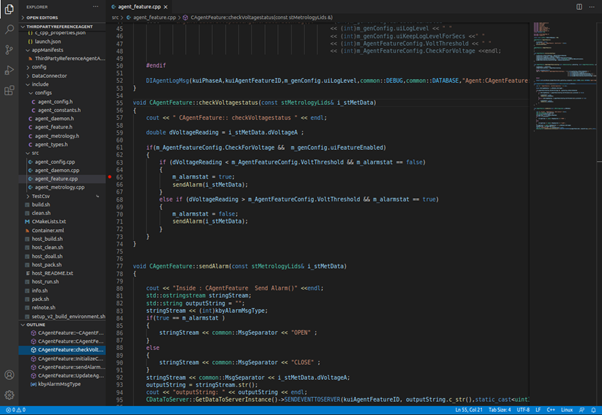
After a short while the VS Code Welcome window opens.
Figure 2 The VS Code Welcome window with ThirdPartyReferenceAgent code in the Explorer pane
-
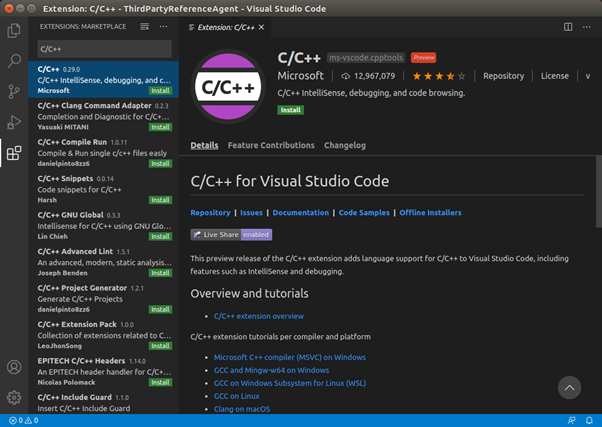
Install the Microsoft C/C++ extension to provide C/C++ language support to VS Code.
This extension also includes IntelliSense and debugging support:
-
On the VS Code menu bar, select File > Preferences > Extensions.
The Extensions pane opens.
-
In the Search Extensions in Marketplace text box, type C/C++.
Microsoft's C/C++ extension appears in the list.
-
Select the C/C++ entry.
-
Click Install.
-
Define the extension's include paths and C++ standard
-
On the VS Code menu bar, select View > Command Palette.
A list of command configurations appears.
-
In the text box, type C/C++.
-
Select C/C++: Edit Configurations (JSON).
VS Code creates c_cpp_properties.json and places it in the .vscode directory.
-
Locate c_cpp_properties.json and edit it to match:

-
When you are done, on the menu bar select File > Save to save the file.
All configuration options for c_cpp_properties.json are documented at Visual Studio Code.
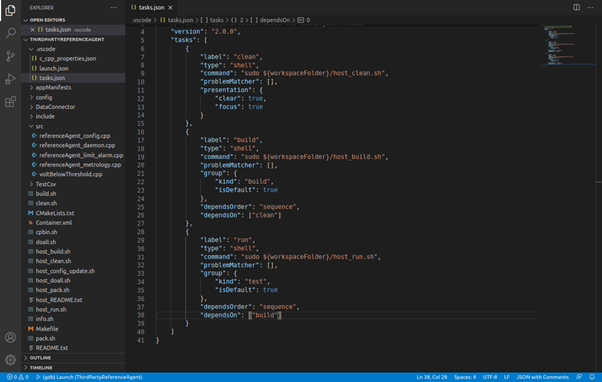
Customize the build and run tasks to point to the provided scripts
-
On the VS Code menu bar, select View > Command Palette.
A list of command configurations appears.
-
In the text box, type tasks.
-
Select Tasks: Configure Default Build Task.
VS Code creates tasks.json and places it in the .vscode directory.
-
Locate tasks.json and edit it to match:
-
When you are done, on the menu bar select File > Save to save the file.
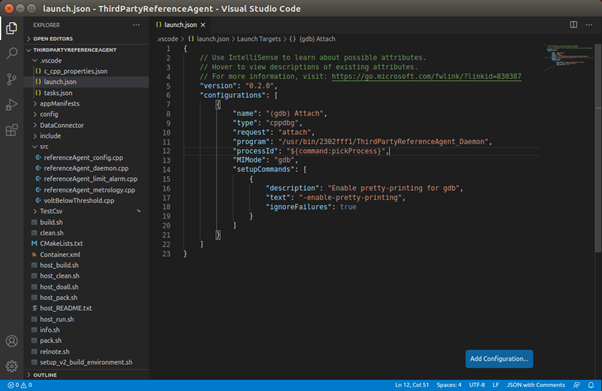
Configure VS Code to use the GDB
-
On the VS Code menu bar, select Run > Add Configuration.
A list of command configurations appears.
-
Select C++ (GDB/LLDB).
VS Code creates launch.json and places it in the .vscode directory.
-
Locate launch.json and edit it to match:
-
When you are done, on the menu bar select File > Save to save the file.
Use the GDB
-
In VS Code, open the file agent_feature.cpp and place a break point on line 65, as shown here:
-
In a terminal window as user dev, use the command cd ~/DistributedIntelligenceDesktopSDK/Agents/ThirdPartyReferenceAgent to navigate to the ThirdPartyReferenceAgent.
-
Use the command sudo ./host_doall.sh” or “sudo ./host_run.sh to start the agent running.
-
Wait for the agent to start running successfully.
-
On the VS Code menu bar, select Run > Start debugging.
The Attach to process window opens.
-
In the Select the process to attach to textbox, type ThirdParty.
-
When it appears, click ThirdPartyReferenceAgent_Daemon.
The message appears in the integrated terminal window: Superuser access is required to attach to a process. Attaching as superuser can potentially harm your computer. Do you want to continue? [y/N]
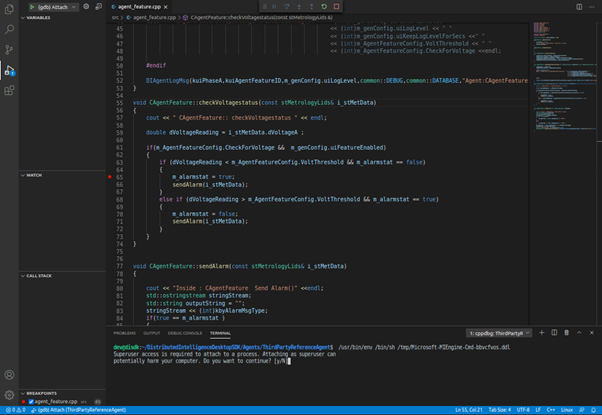
This is a known bug in VS Code.
-
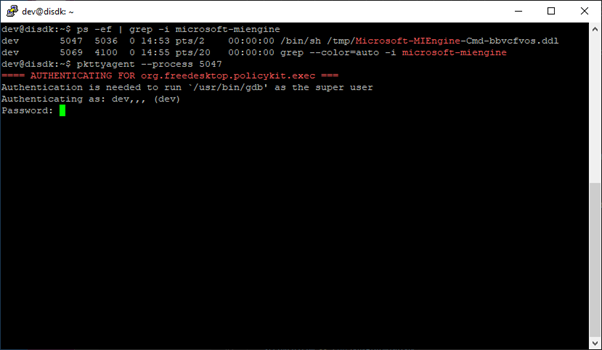
As a workaround, in a new terminal window, use ps -ef | grep -i microsoft-miengine to find the process id (PID) of the integrated VS Code terminal running the debugger.

-
In the same terminal window used in step 2, use pkttyagent --process <pid> to start a textual authentication agent.
...where <pid> is the process PID of the integrated VS Code terminal running the debugger.
Note: In the following example, the PID is 5047. This may differ from your PID.
-
In the VS Code integrated terminal window, type y and press Enter.
This causes an authentication challenge to appear in the new terminal window as shown in the following example.
-
Type the superuser password, then press Enter.
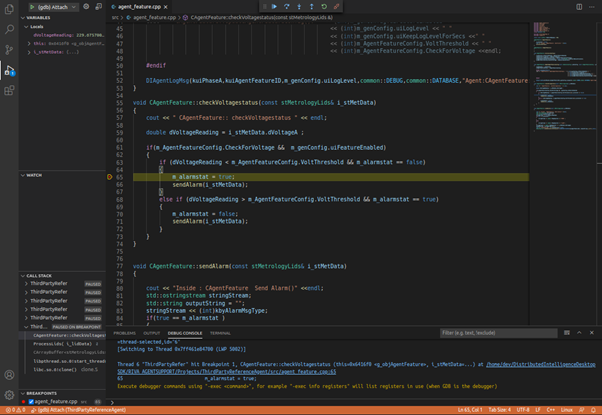
The debugger attaches to the agent and after a short while the breakpoint in the file agent_feature.cpp is reached.
-
As needed, use the keyboard or row of buttons at the top of the window to control the debugger.
Like most debuggers, you can step through the code line by line and view the variables.
As needed, click Disconnect to detach the debugger from the agent.